As I’ve written previously iPhone geolocation using JavaScript is quite easy. In addition to grabbing the location once, you can use the W3C geolocation standard watchposition to get continual updates of the user’s location.
However, you can’t control how often you receive updates. On an iPhone, it sends new positions about once per second. To most web apps, that’s way too often, especially if the user isn’t moving much. The code below only performs the desired action when the new position is different enough than the last position. “Different enough” is 0.1 kilometers, but you can change that to whatever you want in the okdist variable.
This example is built on Mapstraction (as is much of Map Scripting 101), so you can use Google Maps, Bing, MapQuest, or any number of mapping providers. This code works on the iPhone, Android and many desktop browsers. Check out the code below, or see the working demo here.
// Pre-declare variables
var lastloc = mxn.Mapstraction.LatLonPoint(0, 0);
var okdist = 0.1; // km
// Request location updates
navigator.geolocation.watchPosition(foundLocation);

function foundLocation(position)
{
	var lat = position.coords.latitude;
	var lon = position.coords.longitude;
	var posll = new mxn.LatLonPoint(lat, lon);
	if (lastloc.distance(posll) > okdist) {
		lastloc = posll;
		// Your code for when new location is different enough

	}
}
I was delighted to give a workshop today at the annual meeting of the North American Cartographic Information Society (NACIS). These are folks with advanced knowledge of geographic information systems (GIS) and they make what I fondly refer to as “real maps.” There’s a wealth of mapping knowledge that has yet to make its way to the web and I hope some will fill that void.
Much of the workshop centered around the Mapstraction Sandbox, which lets you tweak code and watch it update live. Here are some other tools and code samples I shared during the talk:
My thanks to Tanya Buckingham from NACIS for inviting me after she attended my workshop at Where 2.0.
Let’s say you have a lovely graphic of an area, like a downtown district or a park. It’s a flat, top-down view, like most maps. But it doesn’t quite match up with the streets or other features of a mapping API’s imagery. Before you can overlay your image, you’ll need to georeference it.
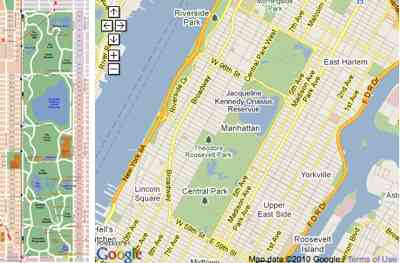
The process is also called rubber sheeting, because you are essentially stretching and manipulating your graphic so that every point of your graphic meets up with the appropriate geographic coordinates.
In the book I use Central Park as an example. I uploaded a graphic from a park brochure to a site called GeoWarper. Then I referenced parts of the graphic with other identifiable areas in an OpenStreetMap version of the same area. GeoWarper then spits out a georeferenced version of the graphic.
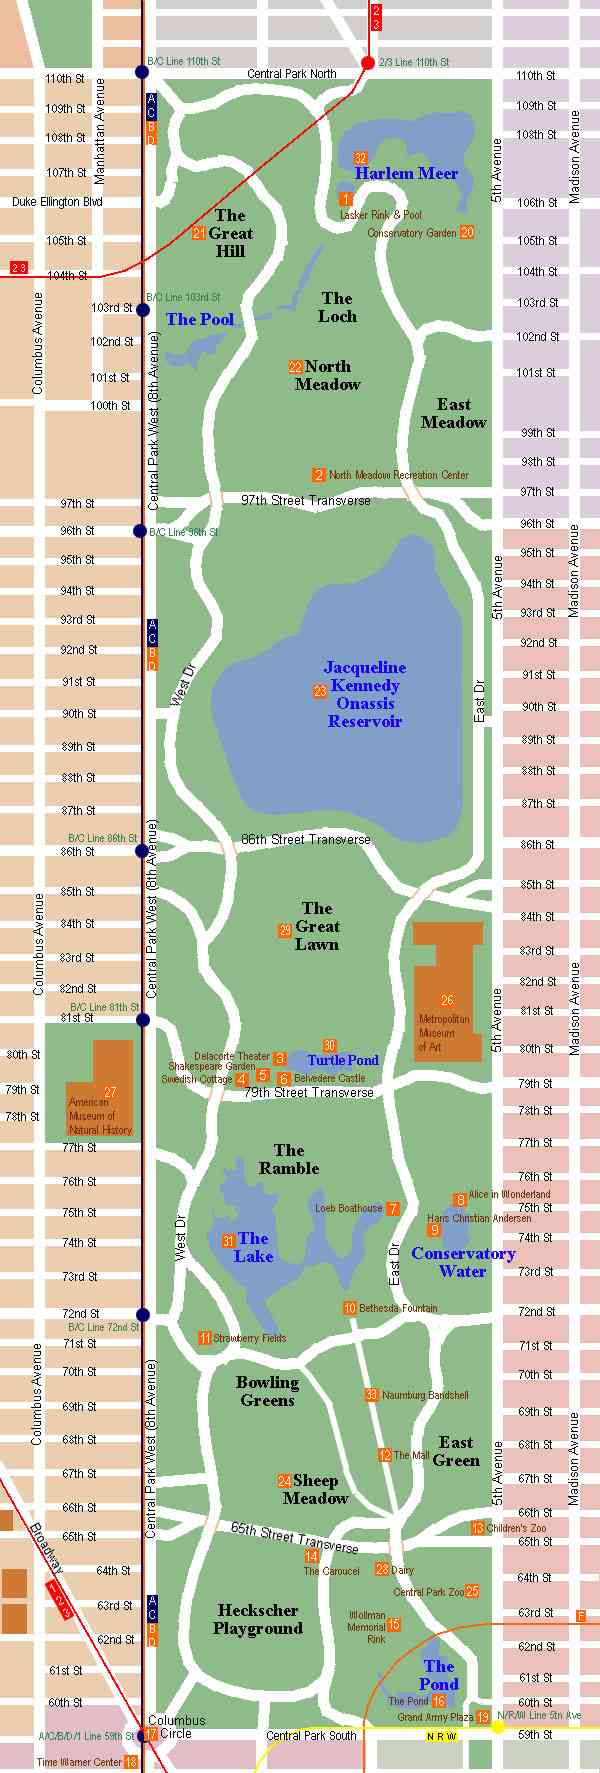
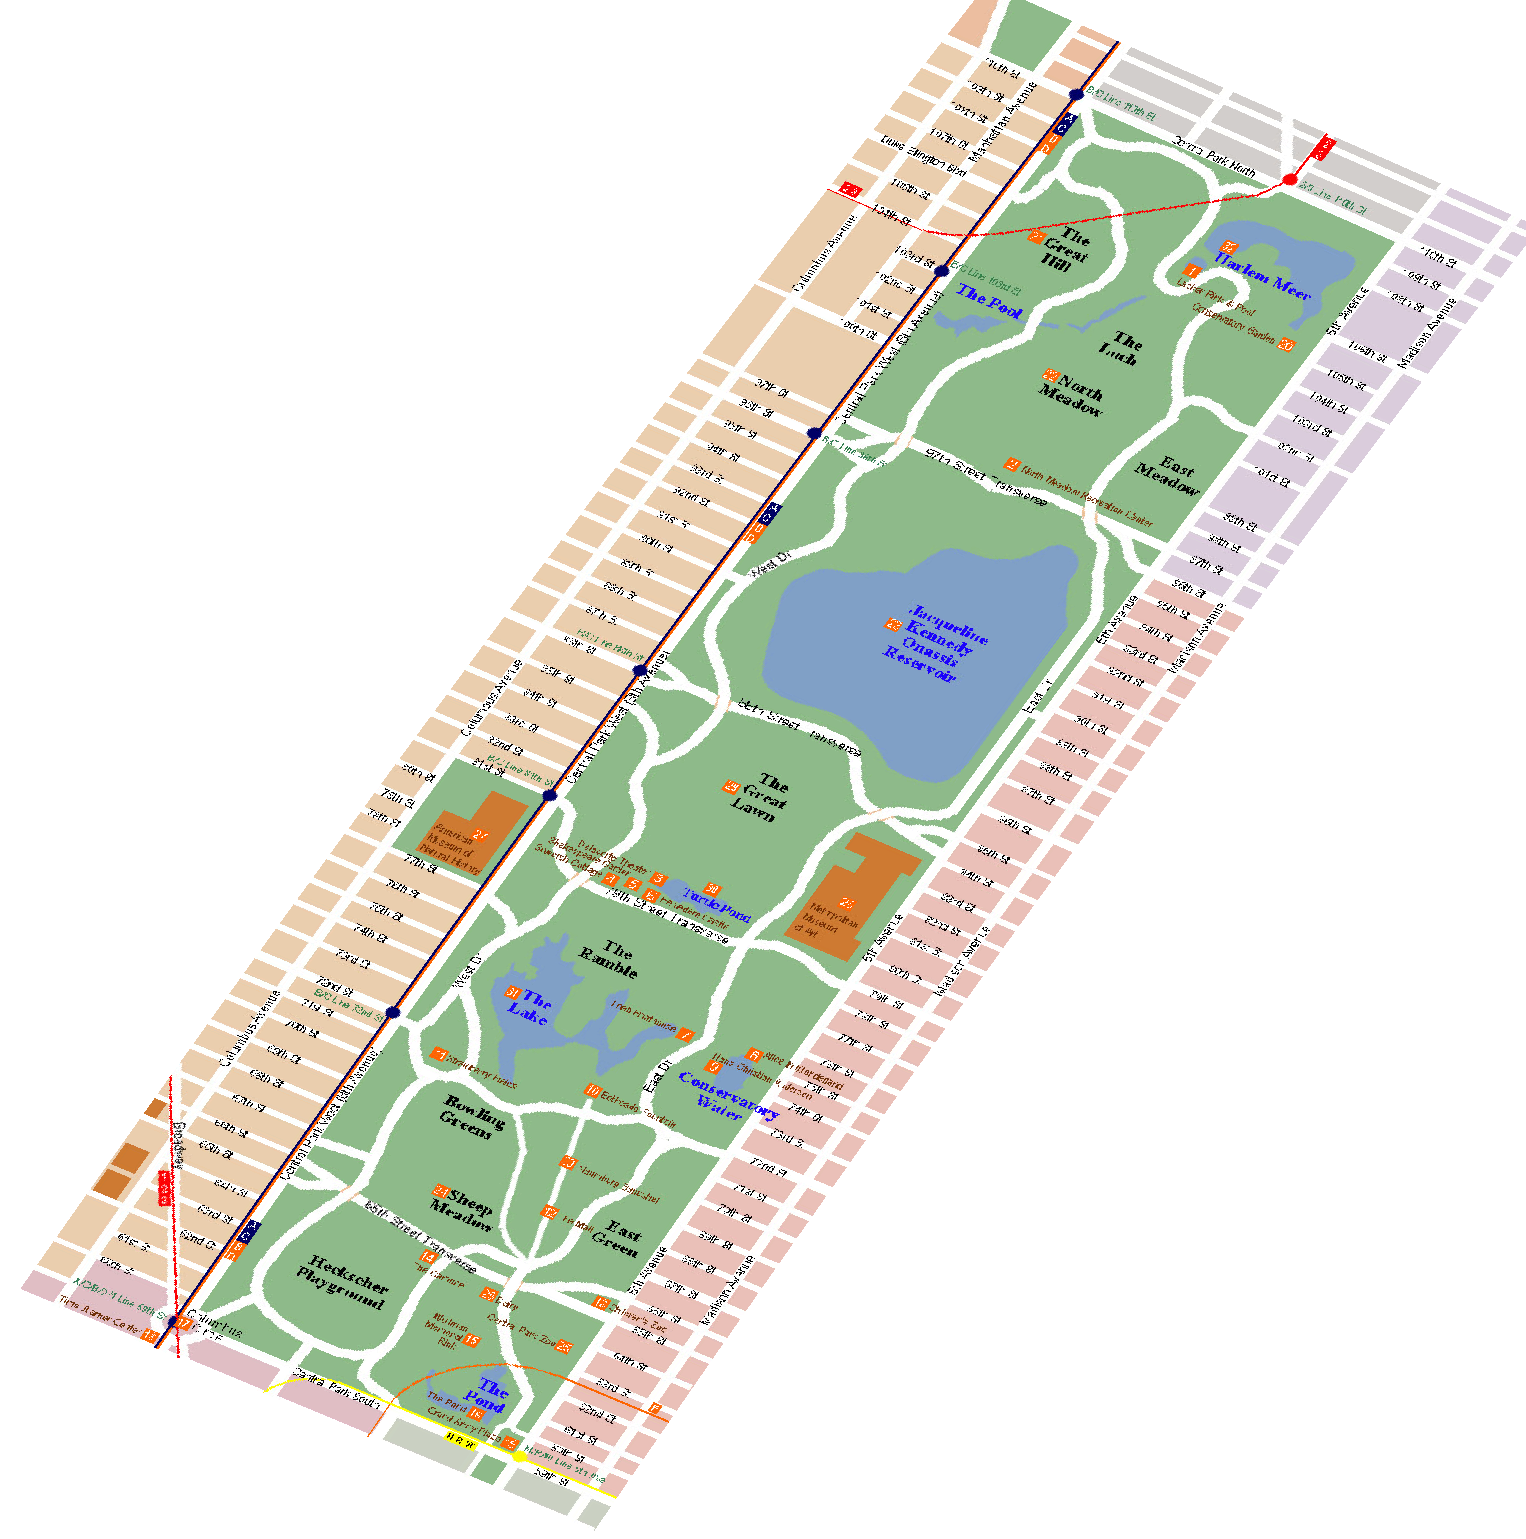
Want to try it out yourself? The original graphic is included above. You can start your own, or use mine. If you just want to see it completed, the warped graphic is also above and the Central Park map is in my examples section.
Many apps use zip codes to determine a user’s location. You can get the results with a geocoder service, or you can roll your own. From the same folks that supply the IP geolocation database, you can download one for U.S. zip codes.
The download is available as a direct database dump or CSV, like this:
"zipcode";"state";"fips_regions";"city";"latitude";"longitude"
"97002";"OR";"41";"Aurora";"45.2574";"-122.799"
"97005";"OR";"41";"Beaverton";"45.4924";"-122.803"
You’ll need to load it into a database and perform lookups yourself (ie, “select latitude, longitude from zips where zipcode=?”), but this is a good way to avoid wasting precious calls on fairly static and finite data.
Zip codes do change from time to time, so the database is updated periodically.
Looking for non-US postal codes? Check these out:
In addition to the W3C geolocation standard (I covered iPhone geolocation previously) and finding your user’s location based on IP, there are a number of services that let users actively share their whereabouts. Most of these services also have APIs, which allow you to access the shared locations (with the users permission, of course).
Here is a selection of location APIs and in some cases, tutorials that help you get started:
Which are your favorites? Am I missing any?
Searching within a specific distance of a point is a common mapping task. Yet, we rarely see the search area visualized, even though it’s rather easy to do. In the book I show two circle overlay methods: one approximates a circle with a polygon and the other overlays a graphic.
When using an image, you’ll want it to be a transparent PNG with the same width and height. The circle should just fit, so that it touches the edges of the graphic. The one I use in the example is swiped from Google Latitude and it’s on the left. Just right-click and choose the option to save the image.

You can also create your own image using the Google Charts API wizard, like the border-less orange graphic above. Use its URL as a starting point at the bottom of the wizard.
If you make a graphic yourself, you’ll need to ensure that the PNG’s background is transparent. Otherwise, there will be a white box around your circle. You can make the circle itself semi-transparent, or rely upon the mapping API to display an opaque file at a percentage of its opacity.
For a working example of the polygon circle overlay, see this geocoded tweet mashup.
Many GPS units and even some mobile phone apps produce a GPX file, which contains a list of saved coordinates. These are usually called “tracks” and are useful for sharing or re-purposing where you’ve been. In the book, I show how to plot tracks on a map.
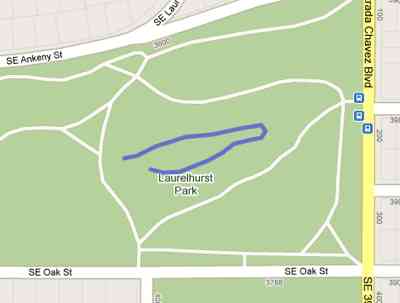
The example from the book uses Portland’s Laurelhurst Park tracks (raw GPX file). If you’d like to create your own tracks with a mobile phone, check out My Tracks for Android or Trails for iPhone.
There are also sites to share GPX files, such as GPXchange.
For those who want a quick introduction to mapping on the web, I’ve offered my Start Here Guide for the last year. My full book is coming soon (did you know you can pre-order Map Scripting 101?), but the guide will remain. In fact, now it’s also available in Spanish.
I’m indebted to Claudio Cossio of Frontera Estates for not only the translation but the idea to offer a Spanish version in the first place. Thank you, Claudio!
So, regardless of whether you want it en ingles o en español, you can Download the Start Here Guide for free.
 I presented a talk on moving beyond the typical map mashup today at SXSW Interactive in Austin. In it, I showed some simple ways to improve your maps, from using Mapstraction to custom map markers to changing the entire map imagery.
If you would like to get a feel for the presentation and examples, my “slides” are one giant HTML file. Really, it’s quite giant. So I’ve included the examples below. View the source, look around. Many of these are explained in detail in Map Scripting 101, but if you have questions I’d be happy to cover some more in-depth on this blog.
The pedometer community site Walker Tracker added a new feature that plots your steps on a route around the rim of the Grand Canyon–or a handful of other locations. And you can invite your friends on the trip, with each avatar shown at a location determined by the user’s step count.

This is the site’s first foray into using maps. Ben, the site’s founder, contracted me to write much of the code for the new feature. Walker Tracker has an active community of step-counters who already take part in a number of competitions on the site. I’m happy to see this new competition type go live into Beta.
I used the site’s API to grab the current competition results and convert steps into a distance. That turns out to be the easy part, as the average person travels a mile in 2,000 steps. So, to keep things fair, we used that constant. No advantage for the long-legged!

Finding out which leg of the journey a user is on was also fairly easy. Once I knew the user’s distance, I could keep a running total of each leg until the next point would make it further than the user’s distance. Then I knew the user was between two particular points. On some routes, the points could be many miles apart. Walker Tracker needed to be more precise than that.
Find a Point Along a Route
The mapping challenge here was to plot the walker at just the right point along the route. That turns out to be a fairly complex problem and the solution has become a section in my book.

The example above shows three points. It’s a two step process to find point X, 0.3 miles between points A and B:
- Find the initial bearing (direction of travel) from point A to B
- Using the bearing, determine the point 0.3 miles along the route between points A and B
As for how to calculate the bearing and the point along the route, these scripts from Movable Type were immensely helpful.
 Hi, I'm Adam. I'm writing a book about developing maps on the web. This site is where I'll share the things I find and help you create your own maps.