Nov 23, 2009
Add Visualizations to Your Google Maps With Cartographer
Using standard markers gets pretty quickly crowded if you have many points. And it’s not always the best way to describe data. Cartographer is a new library that helps you add better content to your maps.
Currently it contains three types of data visualization:
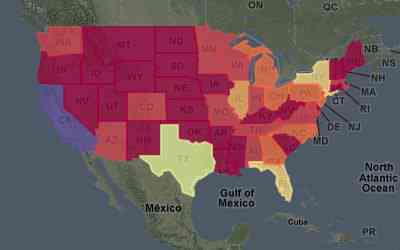
Choropleth

Choropleths are the official name of the maps that shade regions based on data. They became popular in recent U.S. presidential elections to show which candidate was in the lead, but they’re useful for holding any type of data that can be aggregated at a regional level.
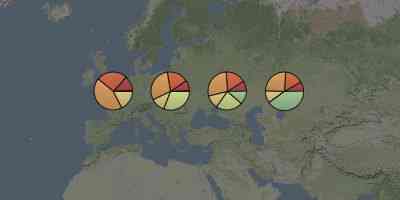
Pie Charts

These are useful for communicating multiple bits of data per location. For example, you might show how many of each age group live in many cities. If each city has a pie chart connected to it, you can show a lot of data at a glance.
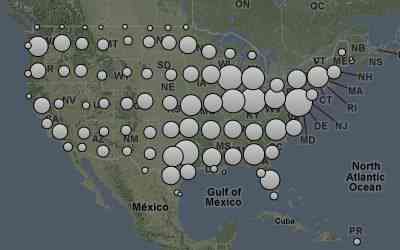
Cluster Map

The most common way to display many markers is to cluster many together for zoomed-out views. Cartographer does this and even gives a visual idea of how many points are below each area by varying the size of the cluster. Users can then zoom in to see more and Cartographer re-clusters where necessary.
Cartographer only works with Google Maps and also requires the Raphael JavaScript library for SVG graphics. There is a lot of value in these sorts of libraries that build upon basic functionality of mapping providers.
via Mike Duffy
 Hi, I'm Adam. I'm writing a book about developing maps on the web. This site is where I'll share the things I find and help you create your own maps.
axiomatic@duponts.jahan” rel=”nofollow”>.…
tnx for info!!…
intolerance@integrity.devious” rel=”nofollow”>.…
ñïàñèáî!!…
compulsively@alger.recordings” rel=”nofollow”>.…
thank you!!…
ditmars@cooperate.slinger” rel=”nofollow”>.…
áëàãîäàðþ….
furnish@rourke.shrouded” rel=”nofollow”>.…
thank you!!…
polymyositis@sharon.impious” rel=”nofollow”>.…
ñïñ!!…
factness@devey.destroying” rel=”nofollow”>.…
ñïñ!!…