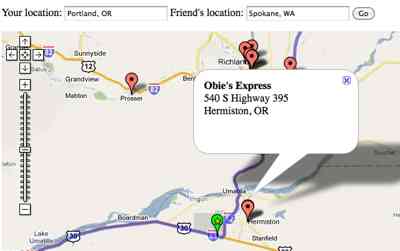
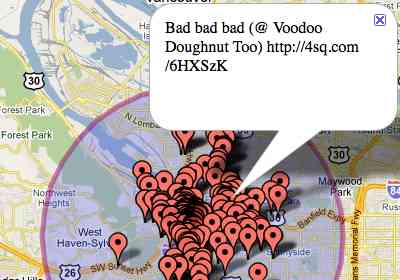
You’re in Portland, but you have a friend in Spokane that you’d like to see. Nobody feels like driving the whole way, but you’re both up to half the trip. Now, how do you determine where to meet? Meet in the Middle finds that midpoint and then searches Yelp for coffee. Yes, Hermiston is a long way to go for coffee.
» Try out the Meet in the Middle Mashup
Of all the examples in the book, I might have been most excited to include this one. It builds upon the Walker Tracker example where I found a point a certain distance along a route. And it works pretty well for both long distances and trips across town.
Want to search for something other than coffee? The code is simple enough that you could probably figure out how to make that change without even looking in my book. (But just in case you need a hint, it’s on page 285).
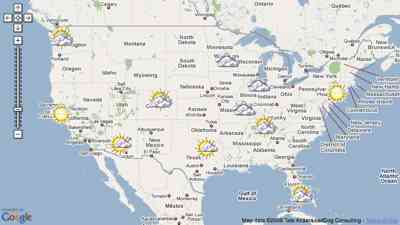
Every morning my father gets the newspaper and checks the weather map on the back page. Never mind that the paper was printed late the night before and that the weather forecast is even older. With the weather mashup in the book, I wanted to make it interactive and as updated as Yahoo Weather can make it.
» Try out the Weather Mashup
I pre-selected 11 cities that I felt were geographically representative, but it’s really easy to add more. The current conditions determine the icon that is placed over the city. When the icon is clicked, the map zooms in to show the forecast.
Though fairly simple, it’s a fun one. And a great first step into connecting to other services to make even better maps.
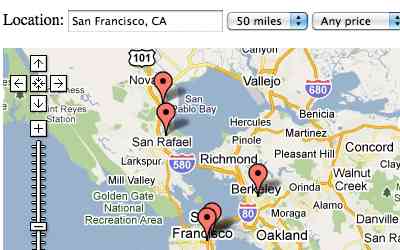
One of my favorite features in Mapstraction, the open source library that lets you write map code once, is filtering. With the feature, you can add data to any marker, then filter based on that data later. In the book, my concert mashup example filters based on price, using data from the Upcoming API.
» Try out the Concerts Mashup
Because concert prices aren’t always simple (i.e., sliding scales of $5-10), there was a little server-side data slicing that had to happen. But the part where non-matching markers disappear quickly is all Mapstraction.
I cover it in-depth in the book, of course, but to get started now, view the source of this basic filtering example.
During the time I wrote the book, Twitter launched its geocoded tweets feature. Now any message can have a location associated with it. That’s pretty cool and I knew I’d need to find room for it in the book. So, I added a Twitter Mashup.
» Try out the Twitter Mashup
It’s less straight-forward than the earthquake mashup, which takes in data, styles it and outputs. Here, you need to do some filtering for whether each tweet is actually geocoded. Why? Because Twitter returns all tweets near the location you specify using any means it can–including the user’s city as listed in their profile.
Additionally, my Twitter mashup uses a geocoder to search for a location and defaults the map view to your city (assuming it can find your location based on your IP address). Then the search radius is shown with circle overlays.
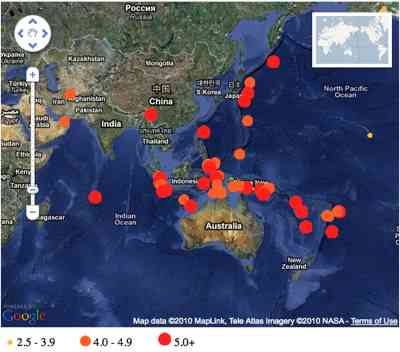
The U.S. Geological Survey (USGS) provides excellent data on earthquakes around the world. And, since they make it available as GeoRSS, it’s a popular example for maps. So, it was a natural to include in my book, as one of the five example mashups in the final chapter.
» Try out the Earthquakes Mashup
Rather than simply overlay the GeoRSS, I chose to provide icons that helped visualize an earthquake’s magnitude. And, since some parts of the world have more seismic activity than others, I provided a means to snap zoom to the hotspot zones.
If you’re looking to recreate this mashup, you’ll want these image files to make it happen:


Around the time I started the book, the group of volunteers behind Mapstraction started working on a new, improved version of the open source wrapper library. This is the mapping API I recommend because it allows developers to write code once that works on any mapping provider. Also, I use Mapstraction throughout the book, so I want to see it be successful. So, for the first time, I contributed code to an open source project.

This new version of Mapstraction is now showing up in production on sites around the web. For example, Nestoria, a real estate search engine based in the UK. Nestoria has long used Mapstraction and helped fund its initial development, so it’s not a big surprise to see if leading the way with the switch to the new version. What is exciting is that Nestoria was able to decrease a user’s download by 100K by switching to the smarter V2 of Mapstraction.
At the same time, Nestoria also switched mapping providers to the third version of Google Maps. I’m proud to say that Nestoria contracted me to help support this provider in Mapstraction. My thanks go to Ed Freyfogle for the opportunity.

Open microblogging platform Identica recently implemented maps on its service. Any status message that has been geocoded will be displayed on a map. And like Nestoria, it chose Mapstraction V2, another good sign.
Want an introduction to Mapstraction? My Start Here Guide has been updated to use the latest version, or check out the API sandbox.
Today I launched a new site to show what is possible with the NextStop API. My site is called unrut and it helps you find new places where you haven’t been before–it helps you get out of a rut!

Enter your location and a search term. Through the magic of Ajax, the results are loaded and plotted on a map. There is a thumbnail photo for every result, plus a recent recommendation from a NextStop user.
The really fun part comes once you’ve marked the places you’ve already been. You’re left with a list of new places to try!
Give it a whirl and let me know what you think.
 Now this should make you feel good about mobile web standards. Mapping pioneer MapQuest is now using the geolocation standard to provide directions from your current location in MapQuest Mobile — m.mapquest.com, which does not work in a non-mobile browser.
When you select a text field, MapQuest provides an option to use your current location. Then, when you submit the form, the browser requests your location.
The MapQuest blog post references Android, but it also works on my iPhone. And, since it’s a standard, it will work in any other mobile browser that uses the JavaScript geolocation I described when the iPhone OS 3.0 was released.
It’s great to see more of this “in the wild,” especially from a major player like MapQuest.
Some giant chunks of data are making their way to web maps and they’re looking slick. When you have millions of records, you can’t simply add a marker for each one. Instead, you aggregate, as these two mashups have done.
Watch trends by location

Trendsmap uses the most popular terms being discussed on Twitter. But the fun part is that, rather than looking at all trending topics, it segments them into location and puts them on a map. So, whatever is big in Portland might be different from Atlanta or London.
Once geolocated tweets are commonplace (it’s coming soon), we’ll see even more of these sorts of apps. Knowing what’s going on in a country, city, or within a quarter mile will be a click away. How might that change how we interact?
Follow government spending

Recovery.gov is tracking billions of dollars in U.S. stimulus money as it flows out of Washington. A nice piece of website real estate is devoted to a map application for slicing and dicing the data. You can see the funding by state, department, agency and awards type.
This sort of accountability it going to become expected at every level of government. You had better believe we’ll need web mappers to help achieve transparency.
Geocoding is an integral part of using mapping APIs, as it converts from human-readable addresses to latitude and longitude points that the providers understand. It’s also not particularly easy to do on your own, so you’ll likely need a provider.
Below you’ll find an extensive, categorized list of geocoding providers.
JavaScript Geocoders
Free Geocoder Web Services
Commercial Web Services
Got any more?
I know I’ve missed some. What other geocoders need to be added to this list?
 Hi, I'm Adam. I'm writing a book about developing maps on the web. This site is where I'll share the things I find and help you create your own maps.