Jul 31, 2010 0
U.S. State Boundaries to use in Maps
Perhaps you’ve seen those maps with geographic regions shaded particular colors? That’s called a Choropleth map and you can create one for U.S. states using simple polygons in Mapstraction.
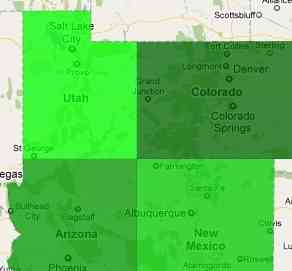
In order to create these shapes, you need the latitude/longitude points that make them up. For some states, that means many points. It takes a lot of work to collect the data, but Rakshith of MapMash has saved us all work.
You can download the state boundaries XML, or see one of the two JavaScript-ready versions below.
First, this follows the simple Four Corners Example from the book, with a variable for each state.
var alaska = [new mxn.LatLonPoint(70.0187, -141.0205),

new mxn.LatLonPoint(70.1292, -141.7291),

... new mxn.LatLonPoint(70.0187, -141.0205)];

var alabama = [new mxn.LatLonPoint(35.0041, -88.1955),

new mxn.LatLonPoint(34.9918, -85.6068), ...
» Simple JavaScript version
A more advanced version uses an object to hold the state name as a key and the collection of points as the value.
var statesobj = {"Alaska": [new mxn.LatLonPoint(70.0187, -141.0205),

new mxn.LatLonPoint(70.1292, -141.7291),

... new mxn.LatLonPoint(70.0187, -141.0205)],

"Alabama": [new mxn.LatLonPoint(35.0041, -88.1955),

new mxn.LatLonPoint(34.9918, -85.6068), ...
» JavaScript object version


 How to Keep Me From Editing Your Maps
 Hi, I'm Adam. I'm writing a book about developing maps on the web. This site is where I'll share the things I find and help you create your own maps.