Oct 3, 2009
Follow Conversations and Dollars on a Map
Some giant chunks of data are making their way to web maps and they’re looking slick. When you have millions of records, you can’t simply add a marker for each one. Instead, you aggregate, as these two mashups have done.
Watch trends by location

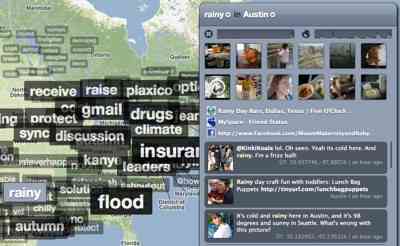
Trendsmap uses the most popular terms being discussed on Twitter. But the fun part is that, rather than looking at all trending topics, it segments them into location and puts them on a map. So, whatever is big in Portland might be different from Atlanta or London.
Once geolocated tweets are commonplace (it’s coming soon), we’ll see even more of these sorts of apps. Knowing what’s going on in a country, city, or within a quarter mile will be a click away. How might that change how we interact?
Follow government spending

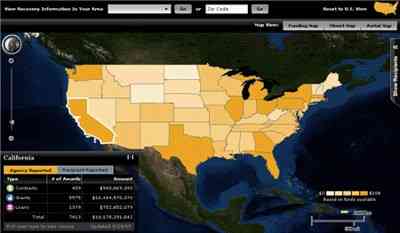
Recovery.gov is tracking billions of dollars in U.S. stimulus money as it flows out of Washington. A nice piece of website real estate is devoted to a map application for slicing and dicing the data. You can see the funding by state, department, agency and awards type.
This sort of accountability it going to become expected at every level of government. You had better believe we’ll need web mappers to help achieve transparency.
 Hi, I'm Adam. I'm writing a book about developing maps on the web. This site is where I'll share the things I find and help you create your own maps.