Apr 17, 2009
Weather, Earthquakes and Concerts — Example Mashups
 I’m totally stoked to have finished the first draft of a really big chapter for the book. Mashup with Data APIs will show at least three example mashups that I think will help beginners learn how to incorporate outside data and create interactive maps.
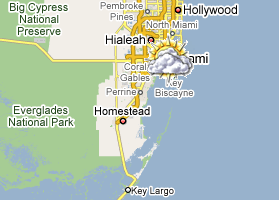
- My Weather mashup shows the current conditions across the U.S. and provides the forecast when you click an icon.
- My Earthquake Mashup shows the earthquakes in the world over the last week, with marker size increasing with the quake’s intensity.
- My Upcoming mashup shows concerts happening in the next week by location, with filtering by ticket price.
If you’re new to mapping, get a feel for how it works by viewing source. On the other hand, if you’re a JavaScript expert, tell me what you would have done differently. In either case, I’d love to hear feedback!
 Hi, I'm Adam. I'm writing a book about developing maps on the web. This site is where I'll share the things I find and help you create your own maps.