Map Scripting

Icon

Create Location-based Web Applications

New Morning Newspaper: Weather Mashup

Interactive nationwide weather map

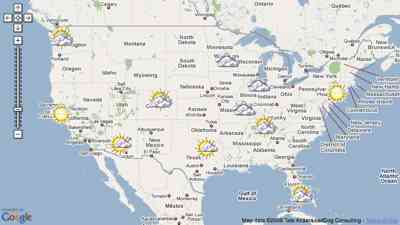
Every morning my father gets the newspaper and checks the weather map on the back page. Never mind that the paper was printed late the night before and that the weather forecast is even older. With the weather mashup in the book, I wanted to make it interactive and as updated as Yahoo Weather can make it.

» Try out the Weather Mashup

I pre-selected 11 cities that I felt were geographically representative, but it’s really easy to add more. The current conditions determine the icon that is placed over the city. When the icon is clicked, the map zooms in to show the forecast.

Though fairly simple, it’s a fun one. And a great first step into connecting to other services to make even better maps.

Find Concerts: an Upcoming Mashup

Upcoming Concerts near San Francisco

One of my favorite features in Mapstraction, the open source library that lets you write map code once, is filtering. With the feature, you can add data to any marker, then filter based on that data later. In the book, my concert mashup example filters based on price, using data from the Upcoming API.

» Try out the Concerts Mashup

Because concert prices aren’t always simple (i.e., sliding scales of $5-10), there was a little server-side data slicing that had to happen. But the part where non-matching markers disappear quickly is all Mapstraction.

I cover it in-depth in the book, of course, but to get started now, view the source of this basic filtering example.

Nearby Tweets: a Twitter Mashup

Twitter search near Portland

During the time I wrote the book, Twitter launched its geocoded tweets feature. Now any message can have a location associated with it. That’s pretty cool and I knew I’d need to find room for it in the book. So, I added a Twitter Mashup.

» Try out the Twitter Mashup

It’s less straight-forward than the earthquake mashup, which takes in data, styles it and outputs. Here, you need to do some filtering for whether each tweet is actually geocoded. Why? Because Twitter returns all tweets near the location you specify using any means it can–including the user’s city as listed in their profile.

Additionally, my Twitter mashup uses a geocoder to search for a location and defaults the map view to your city (assuming it can find your location based on your IP address). Then the search radius is shown with circle overlays.

See What’s Shaking: Earthquake Mashup

Earthquake mashup example screenshot

The U.S. Geological Survey (USGS) provides excellent data on earthquakes around the world. And, since they make it available as GeoRSS, it’s a popular example for maps. So, it was a natural to include in my book, as one of the five example mashups in the final chapter.

» Try out the Earthquakes Mashup

Rather than simply overlay the GeoRSS, I chose to provide icons that helped visualize an earthquake’s magnitude. And, since some parts of the world have more seismic activity than others, I provided a means to snap zoom to the hotspot zones.

If you’re looking to recreate this mashup, you’ll want these image files to make it happen:
For 5.0+ earthquakesFor 4.0-4.9 earthquakesFor small (2.5-3.9) earthquakes
Tiny map of the world

U.S. State Boundaries to use in Maps

Perhaps you’ve seen those maps with geographic regions shaded particular colors? That’s called a Choropleth map and you can create one for U.S. states using simple polygons in Mapstraction.

Four corners state shapes

In order to create these shapes, you need the latitude/longitude points that make them up. For some states, that means many points. It takes a lot of work to collect the data, but Rakshith of MapMash has saved us all work.

You can download the state boundaries XML, or see one of the two JavaScript-ready versions below.

First, this follows the simple Four Corners Example from the book, with a variable for each state.

var alaska = [new mxn.LatLonPoint(70.0187, -141.0205),
new mxn.LatLonPoint(70.1292, -141.7291),
... new mxn.LatLonPoint(70.0187, -141.0205)];
var alabama = [new mxn.LatLonPoint(35.0041, -88.1955),
new mxn.LatLonPoint(34.9918, -85.6068), ...

» Simple JavaScript version

A more advanced version uses an object to hold the state name as a key and the collection of points as the value.

var statesobj = {"Alaska": [new mxn.LatLonPoint(70.0187, -141.0205),
new mxn.LatLonPoint(70.1292, -141.7291),
... new mxn.LatLonPoint(70.0187, -141.0205)],
"Alabama": [new mxn.LatLonPoint(35.0041, -88.1955),
new mxn.LatLonPoint(34.9918, -85.6068), ...

» JavaScript object version

Overlay Images at the Proper Map Location

Let’s say you have a lovely graphic of an area, like a downtown district or a park. It’s a flat, top-down view, like most maps. But it doesn’t quite match up with the streets or other features of a mapping API’s imagery. Before you can overlay your image, you’ll need to georeference it.

Central Park example image and map

The process is also called rubber sheeting, because you are essentially stretching and manipulating your graphic so that every point of your graphic meets up with the appropriate geographic coordinates.

In the book I use Central Park as an example. I uploaded a graphic from a park brochure to a site called GeoWarper. Then I referenced parts of the graphic with other identifiable areas in an OpenStreetMap version of the same area. GeoWarper then spits out a georeferenced version of the graphic.

Central Park originalCentral Park original

Want to try it out yourself? The original graphic is included above. You can start your own, or use mine. If you just want to see it completed, the warped graphic is also above and the Central Park map is in my examples section.

Roll Your Own Postal Code Database

Many apps use zip codes to determine a user’s location. You can get the results with a geocoder service, or you can roll your own. From the same folks that supply the IP geolocation database, you can download one for U.S. zip codes.

The download is available as a direct database dump or CSV, like this:

"zipcode";"state";"fips_regions";"city";"latitude";"longitude"
"97002";"OR";"41";"Aurora";"45.2574";"-122.799"
"97005";"OR";"41";"Beaverton";"45.4924";"-122.803"

You’ll need to load it into a database and perform lookups yourself (ie, “select latitude, longitude from zips where zipcode=?”), but this is a good way to avoid wasting precious calls on fairly static and finite data.

Zip codes do change from time to time, so the database is updated periodically.

Looking for non-US postal codes? Check these out:

Location APIs: FourSquare, Latitude, etc

In addition to the W3C geolocation standard (I covered iPhone geolocation previously) and finding your user’s location based on IP, there are a number of services that let users actively share their whereabouts. Most of these services also have APIs, which allow you to access the shared locations (with the users permission, of course).

Here is a selection of location APIs and in some cases, tutorials that help you get started:

Which are your favorites? Am I missing any?

Add Search Radius with Circle Overlays

Searching within a specific distance of a point is a common mapping task. Yet, we rarely see the search area visualized, even though it’s rather easy to do. In the book I show two circle overlay methods: one approximates a circle with a polygon and the other overlays a graphic.

When using an image, you’ll want it to be a transparent PNG with the same width and height. The circle should just fit, so that it touches the edges of the graphic. The one I use in the example is swiped from Google Latitude and it’s on the left. Just right-click and choose the option to save the image.

Circle image from Google LatitudeCircle image from Google Charts

You can also create your own image using the Google Charts API wizard, like the border-less orange graphic above. Use its URL as a starting point at the bottom of the wizard.

If you make a graphic yourself, you’ll need to ensure that the PNG’s background is transparent. Otherwise, there will be a white box around your circle. You can make the circle itself semi-transparent, or rely upon the mapping API to display an opaque file at a percentage of its opacity.

For a working example of the polygon circle overlay, see this geocoded tweet mashup.

Use GPS “Tracks” from GPX Files

Many GPS units and even some mobile phone apps produce a GPX file, which contains a list of saved coordinates. These are usually called “tracks” and are useful for sharing or re-purposing where you’ve been. In the book, I show how to plot tracks on a map.

GPX tracks in Laurelhurst Park

The example from the book uses Portland’s Laurelhurst Park tracks (raw GPX file). If you’d like to create your own tracks with a mobile phone, check out My Tracks for Android or Trails for iPhone.

There are also sites to share GPX files, such as GPXchange.

Adam DuVanderHi, I'm Adam. I'm writing a book about developing maps on the web. This site is where I'll share the things I find and help you create your own maps. Find out more.

Map Scripting 101